In the first half of 2026, the net increase of dental institutions nationwide reached 4,687: the ratio of openings to closures stood at 4.37:1, with inter-provincial divergence intensifying.
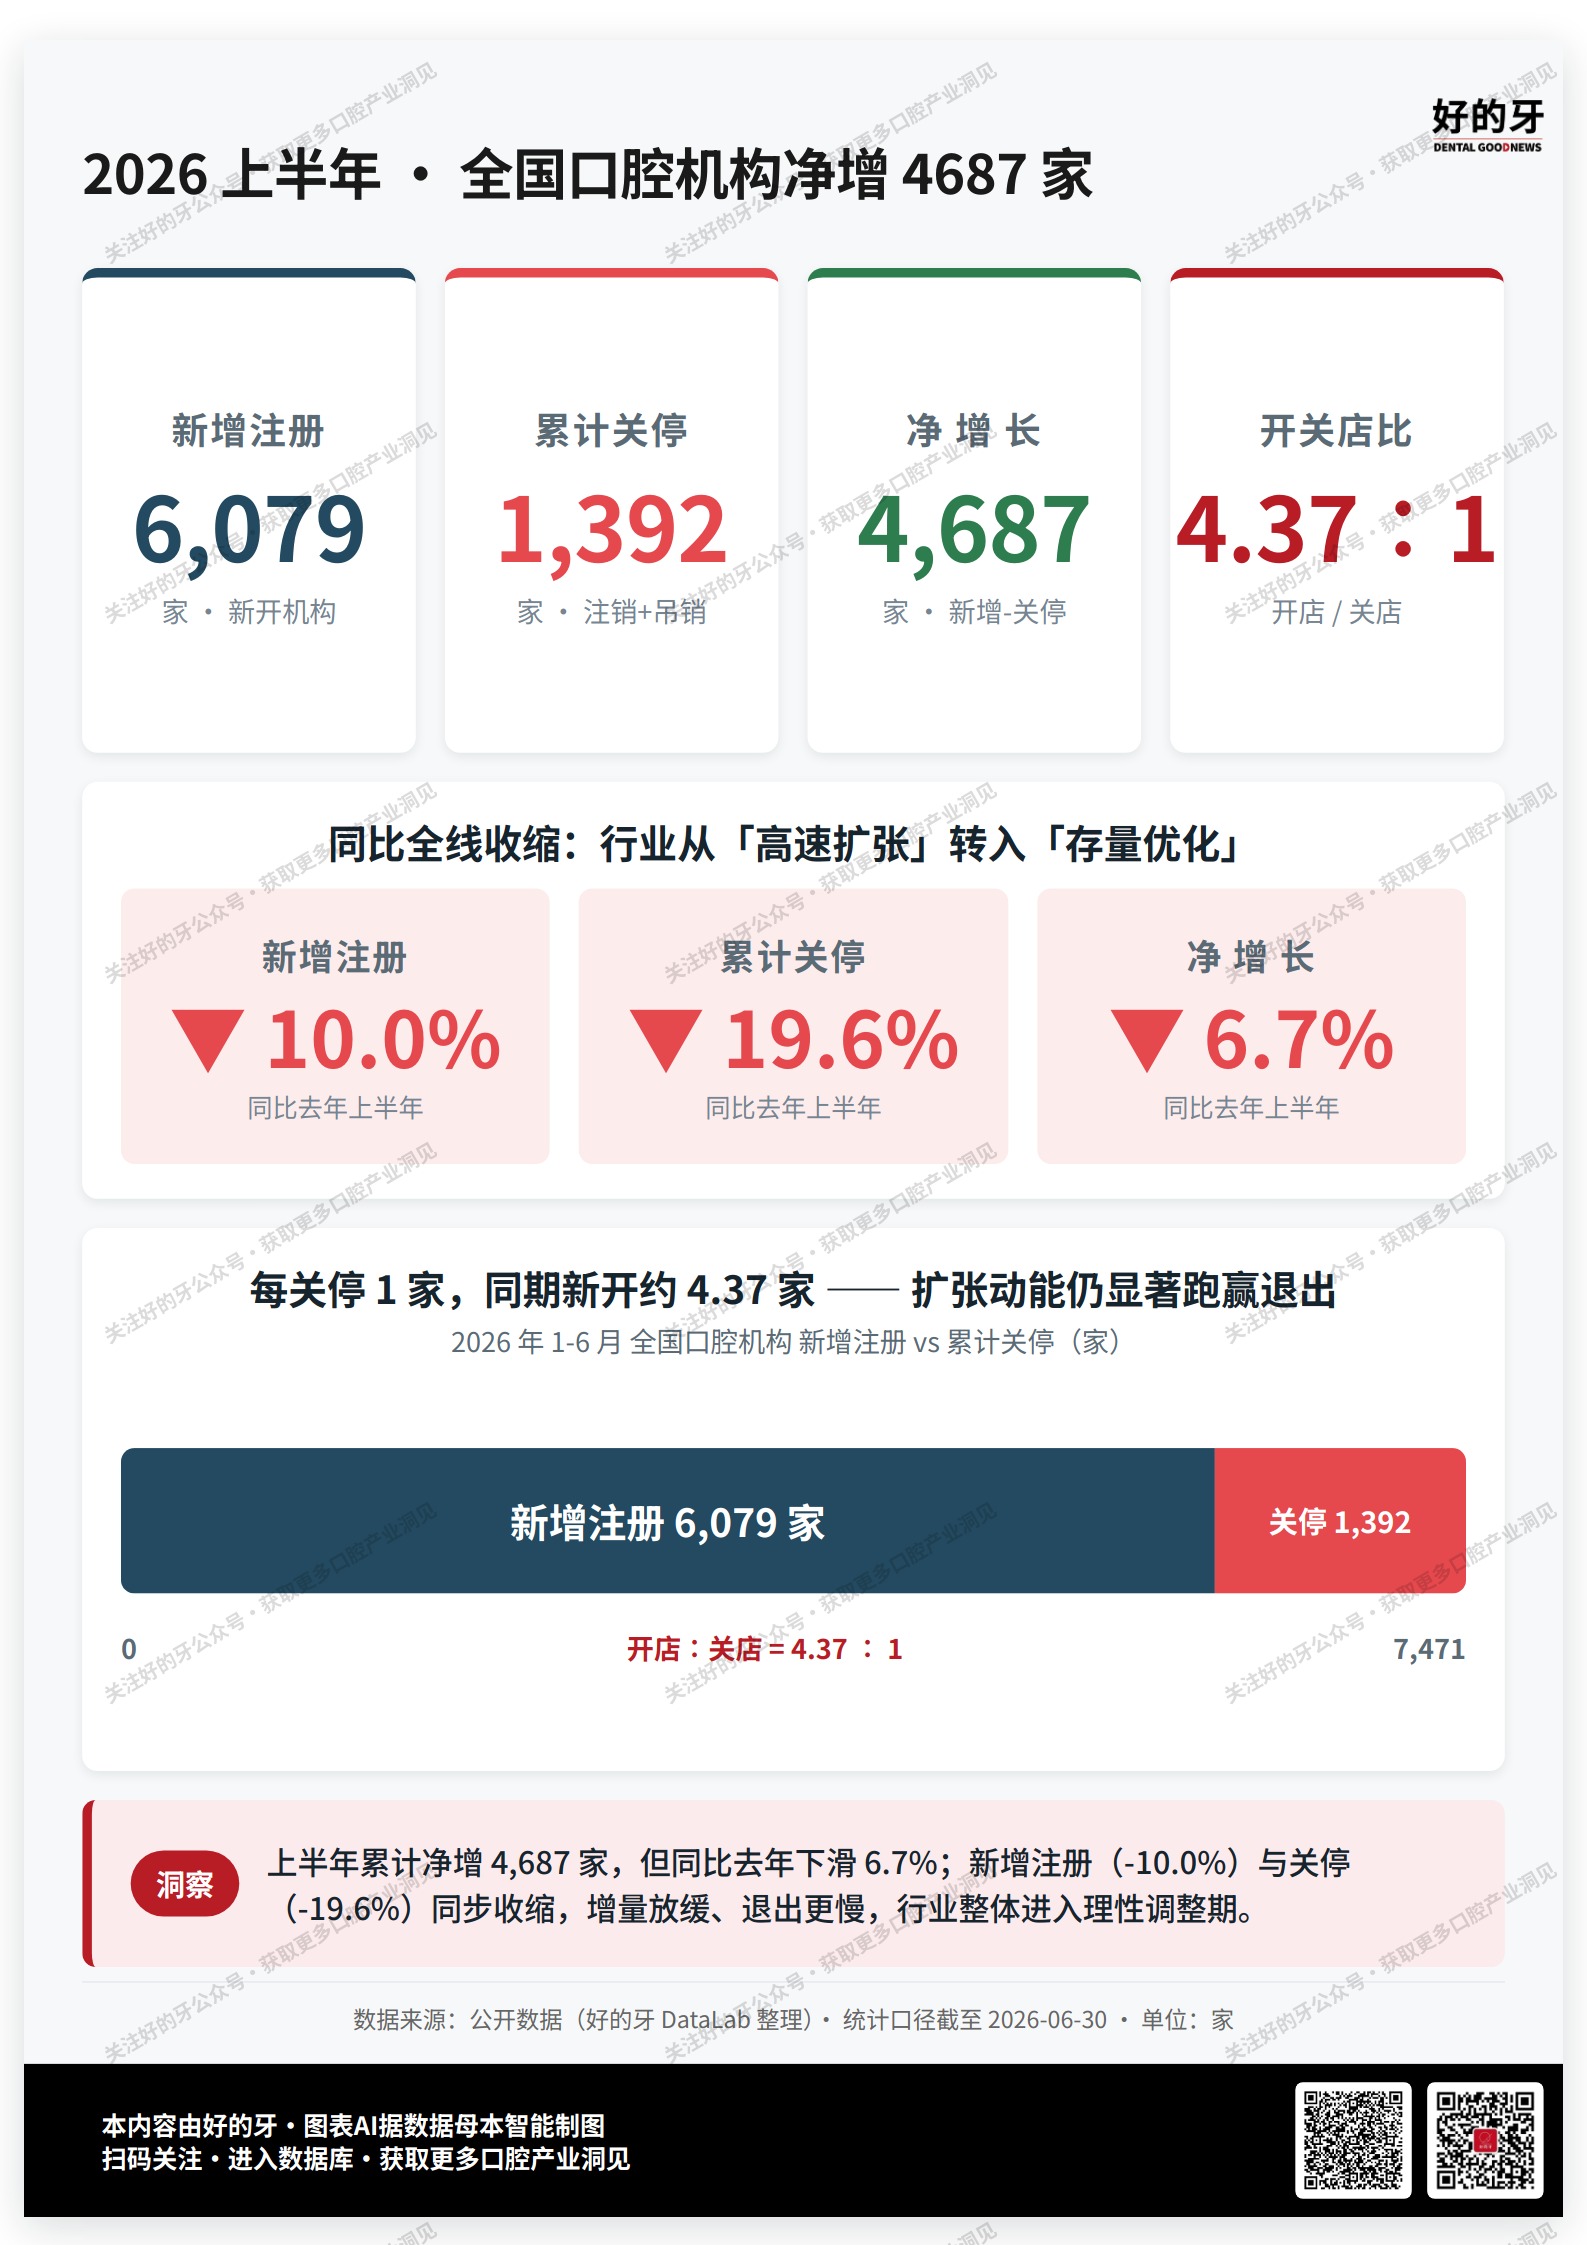
Recently, DENTALGOODNEWS (Leading Dental Industry Media, DGN) DataLab released the "First Half of 2026 National Dental Institution Growth and Decline Data Report." We observed that in the first half of the year, 6,079 new dental institutions were registered nationwide, 1,392 closed, resulting in a net increase of 4,687, with an opening-to-closing ratio of 4.37:1. Overall, the industry remains on a net growth trajectory. However, the net growth narrowed by 6.7% year-over-year, with the top 10 provinces accounting for 60.4% of the total. The inter-provincial divergence—where some regions are expanding while others are contracting—is becoming entrenched. These changes collectively point to a judgment: the industry's growth momentum is shifting from "broad-based gains" to "concentration," and the prelude to a stock competition has begun. (Data source: DGN DataLab's national dental medical institution business registration database, statistics as of June 30, 2026)
I. Growth Inertia Persists, but Momentum is Accelerating Toward Leading Provinces
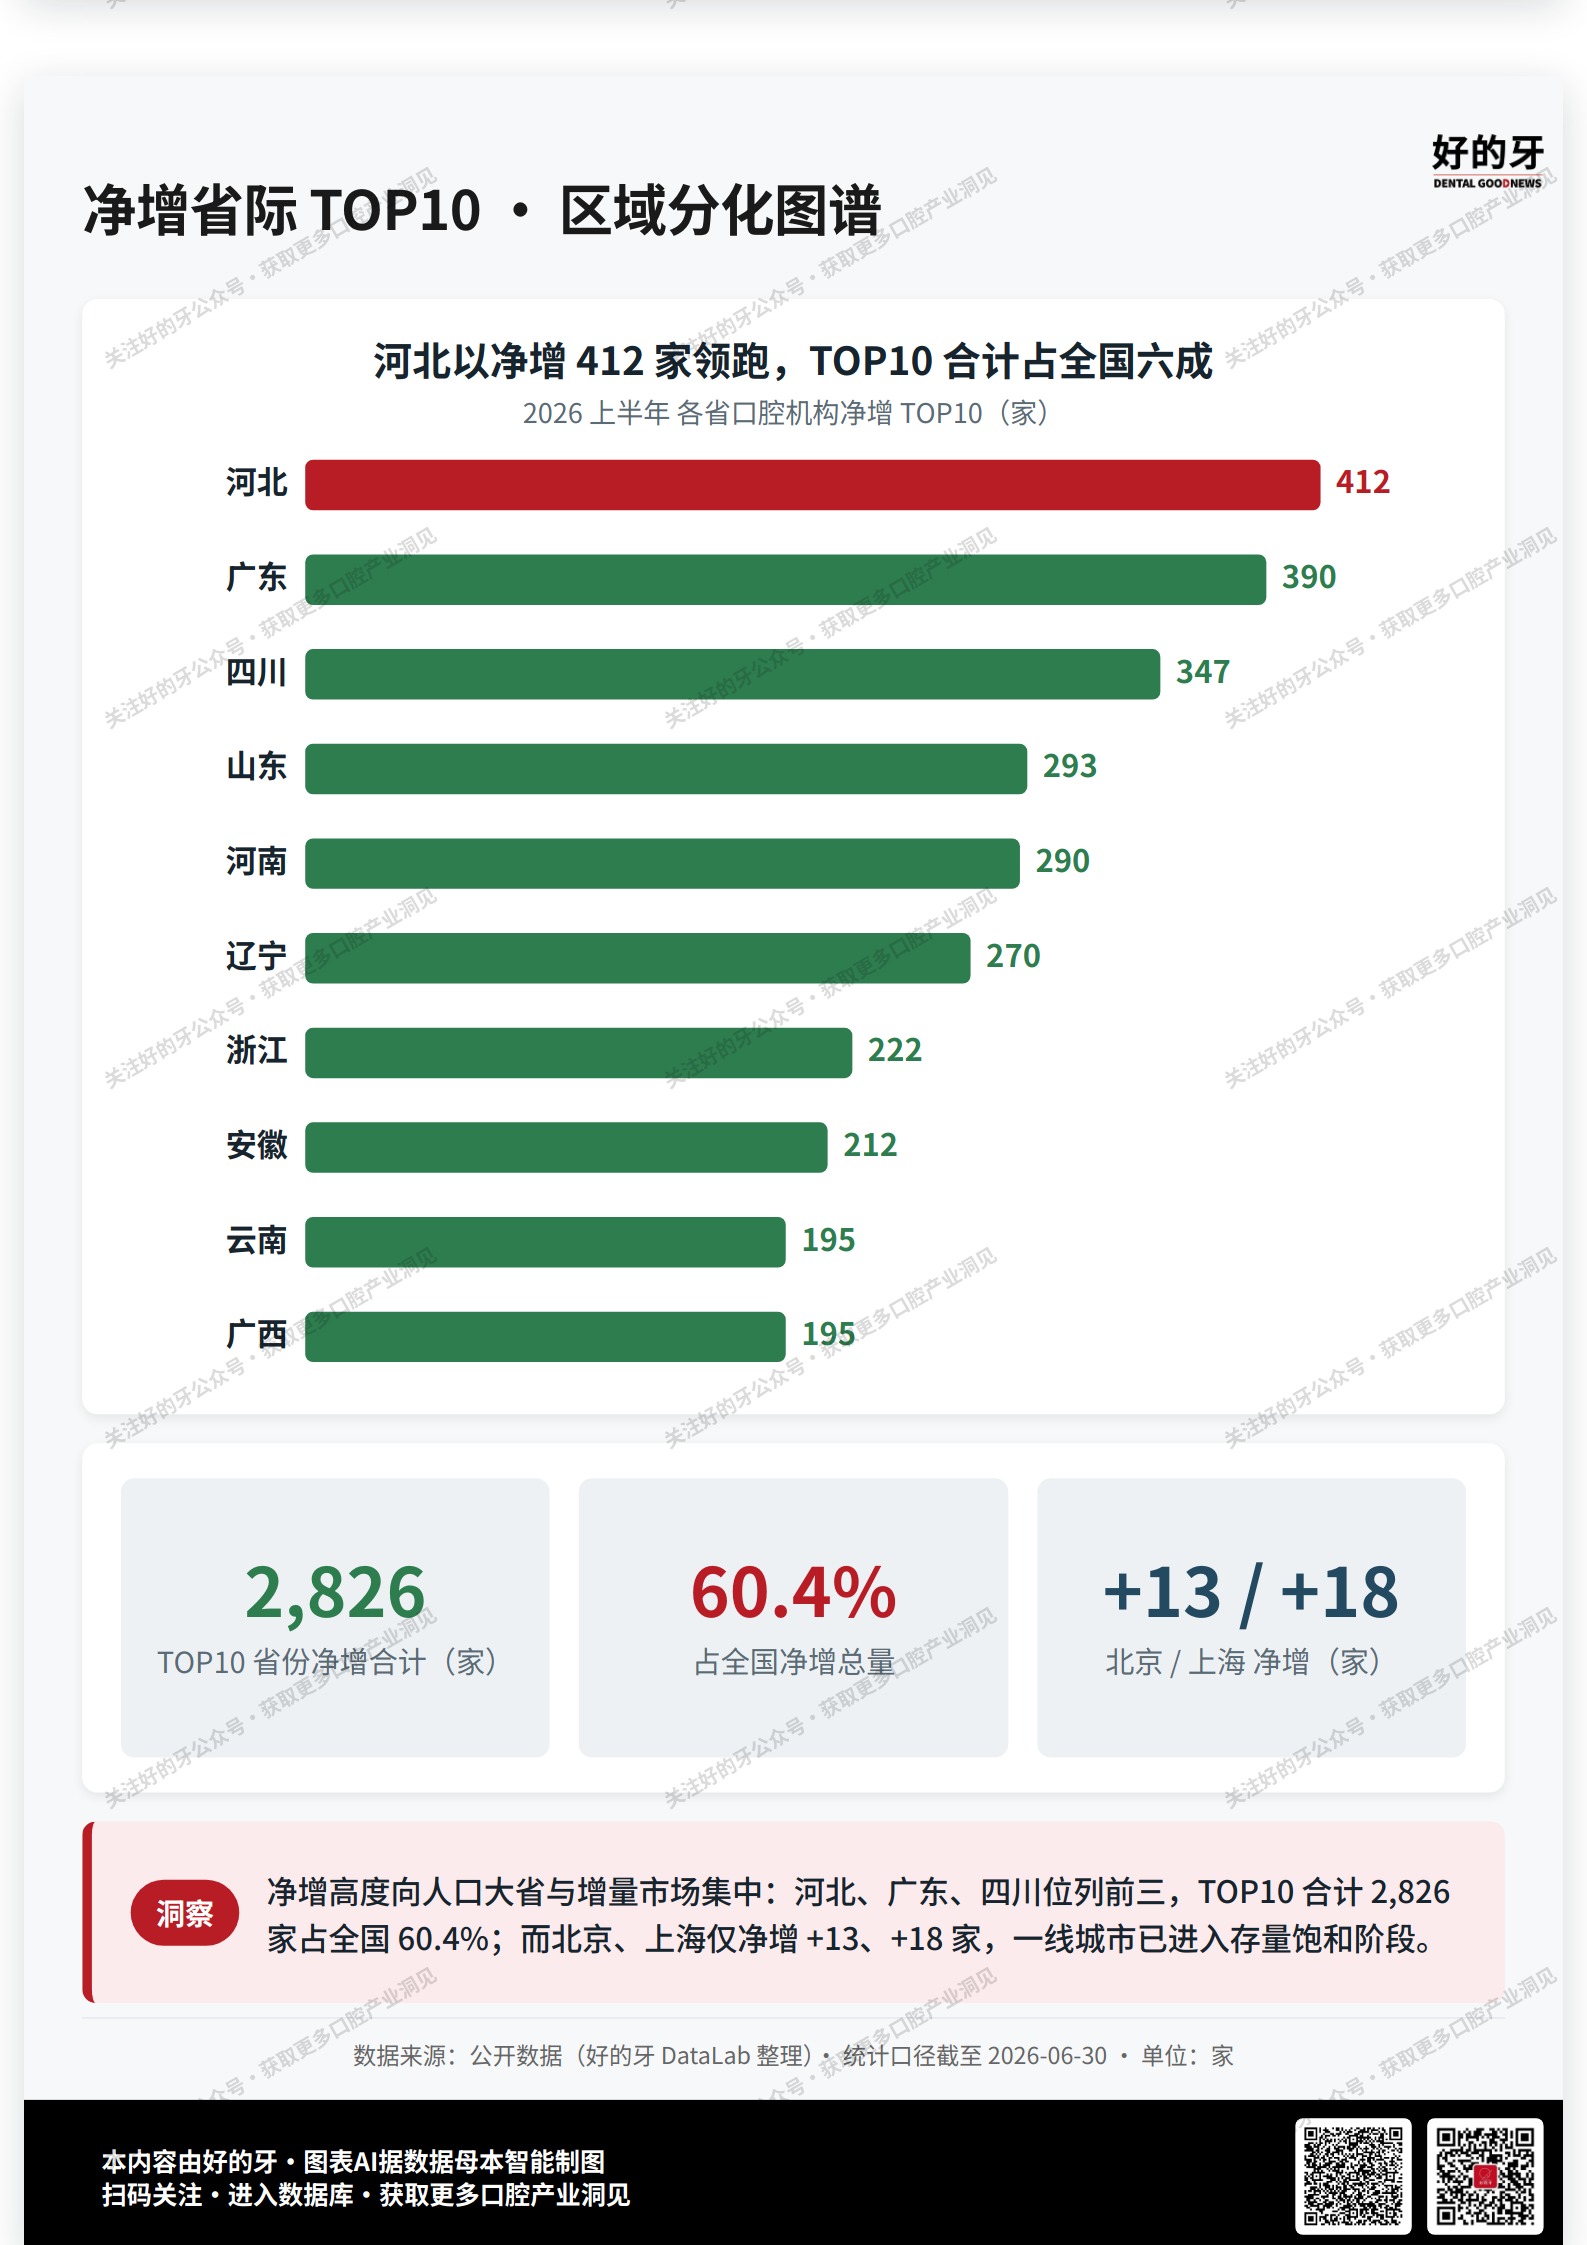
Data shows a net increase of 4,687 in the first half of the year, with an opening-to-closing ratio of 4.37:1—for every one closure, more than four new institutions entered. However, new registrations decreased by 10% year-over-year, and net growth narrowed by 6.7%, indicating a slowdown in growth itself. More critically, the five provinces of Hebei, Guangdong, Sichuan, Shandong, and Henan collectively added 1,732 net new institutions, accounting for 37.0% of the national total; the top 10 provinces combined added 2,826 net new institutions, with a concentration rate of 60.4%. This means over 60% of new supply occurred in less than one-third of the provinces. Growth is no longer widespread but is accelerating toward a few leading regions. For the more than 20 provinces not in the top 10, the space for net growth is being squeezed.
II. V-Shaped Monthly Rhythm Reveals: March Rebound is "Volume Catch-Up," Not a "Recovery"
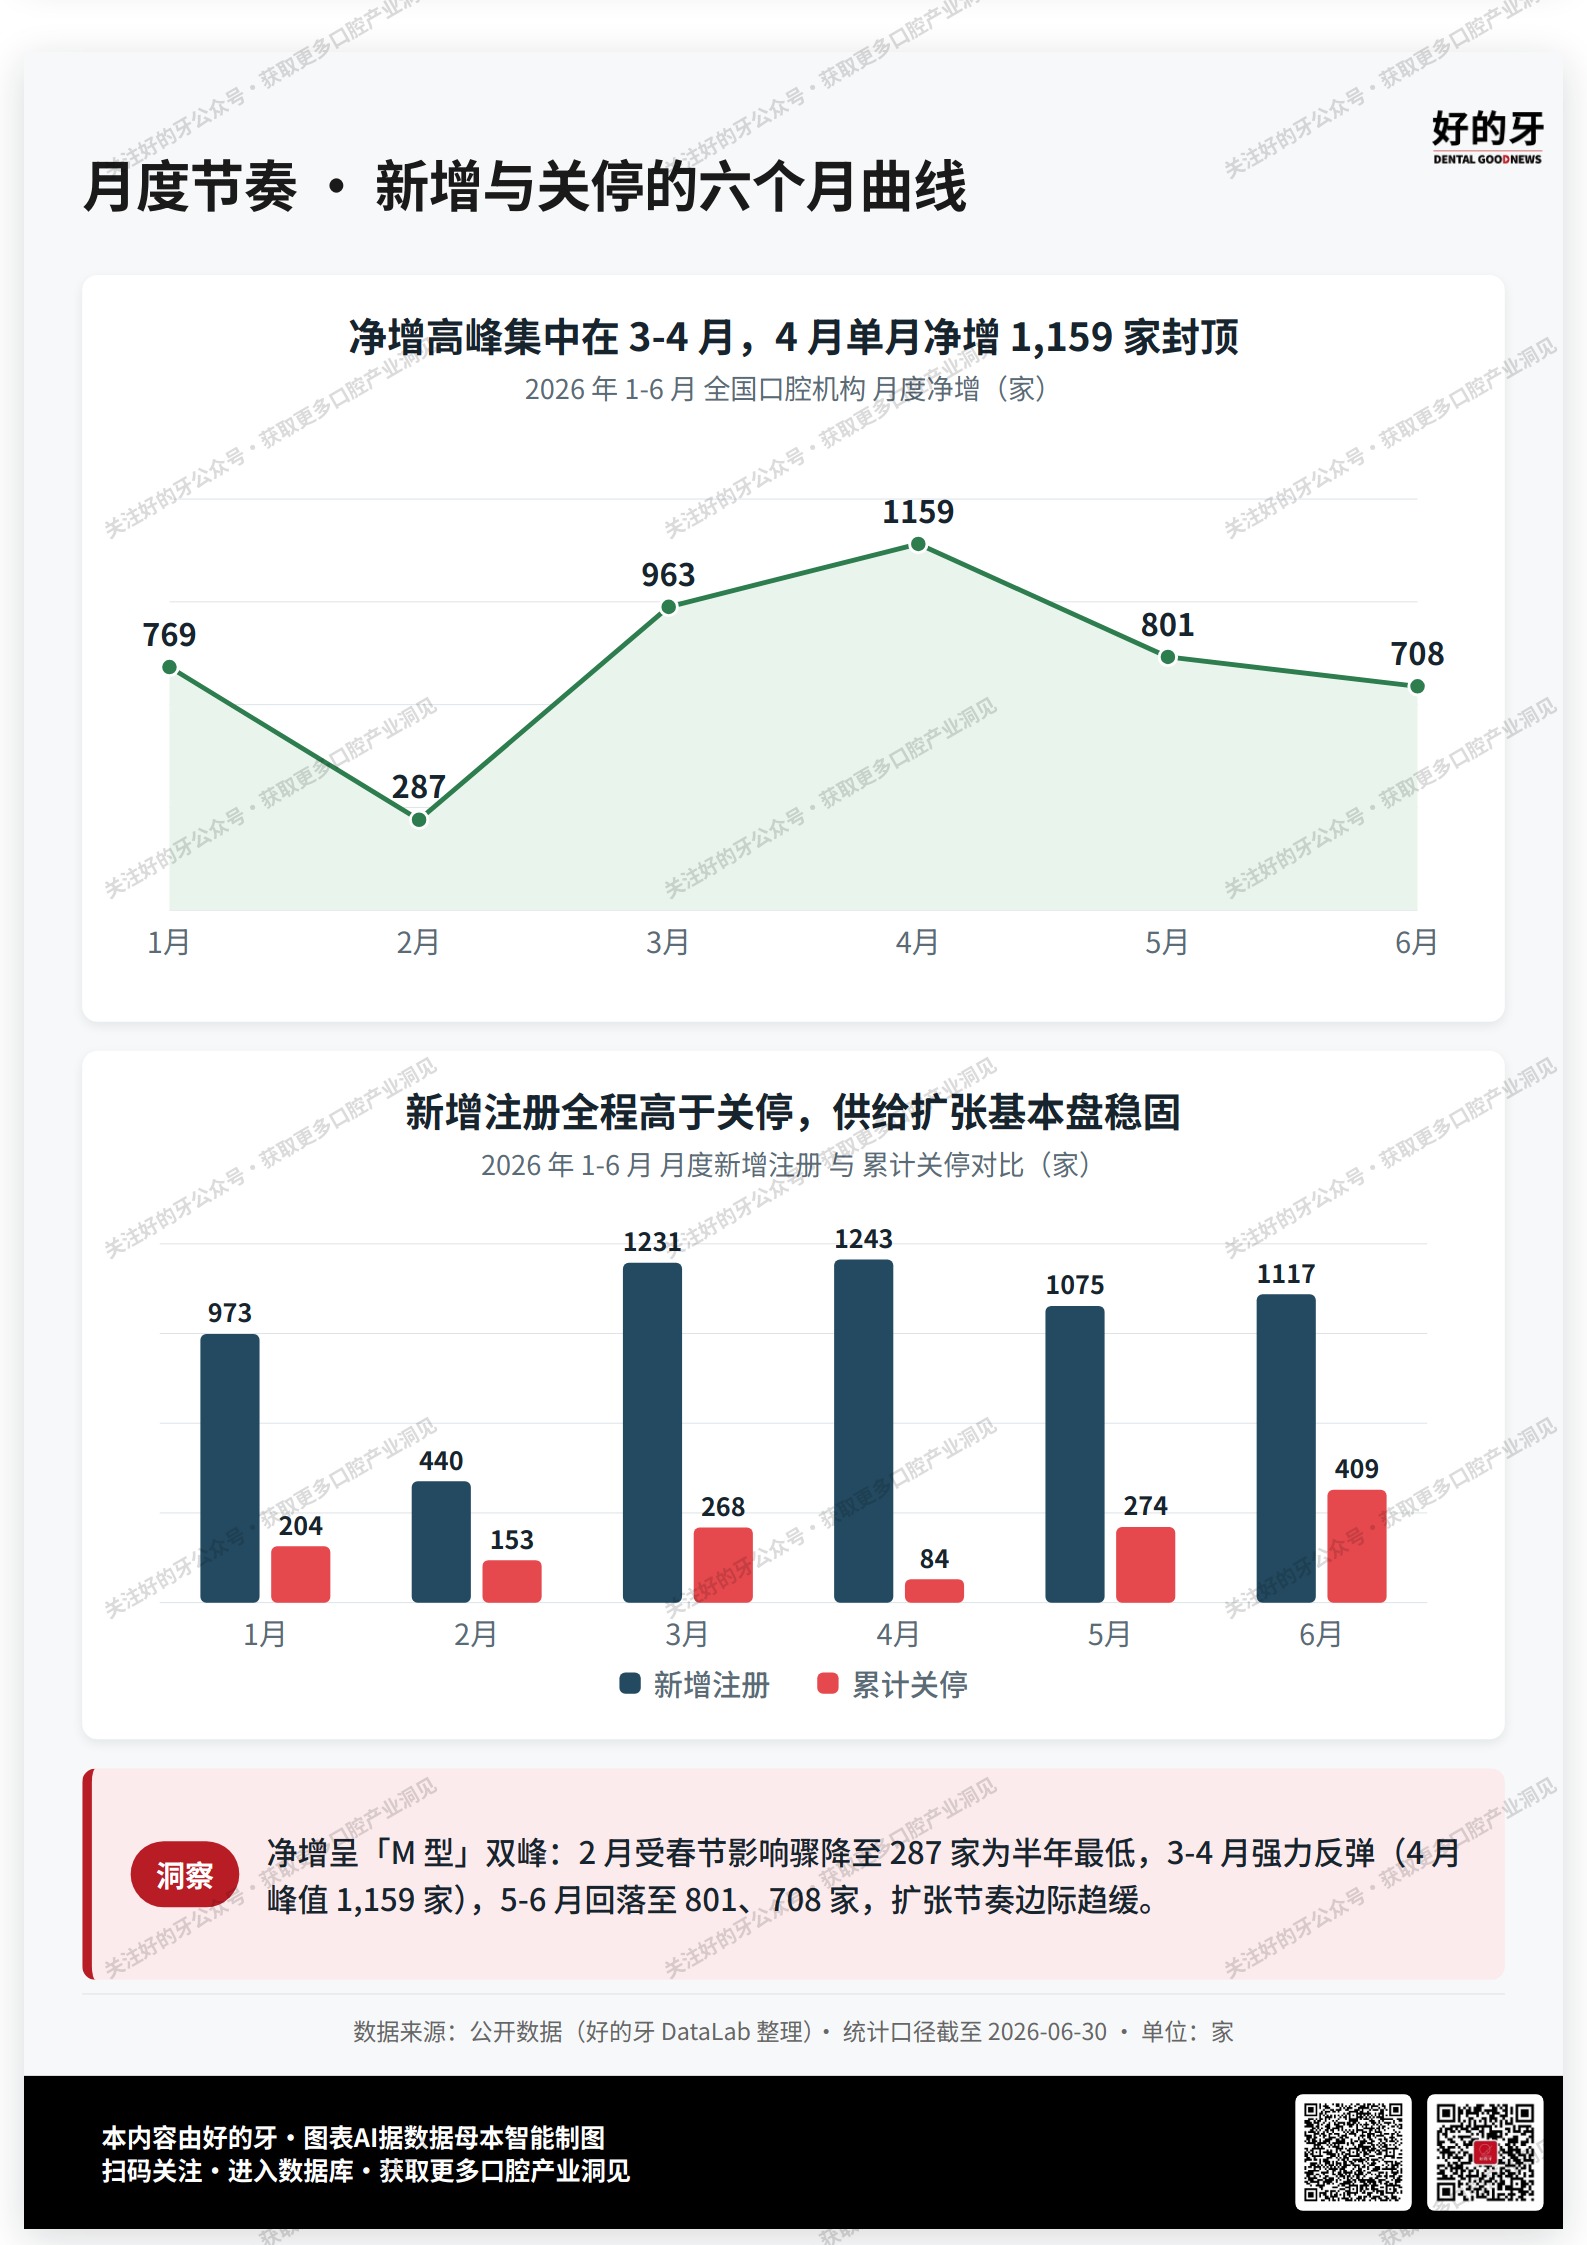
Monthly data shows a clear V-shaped pattern: net growth in February was only 287, the lowest in the half-year; it quickly rebounded to 963 in March, a +236% month-over-month increase; and peaked at 1,159 in April, the half-year high. However, we note a more critical set of data: over the six months of the first half, net growth was negative month-over-month four times and positive only twice; monthly net growth fluctuated widely between 287 and 1,159, with a range of 872. The peak in March-April is more likely a concentrated release of suppressed demand from the Chinese New Year and a normal return to annual operational rhythms, rather than a structural expansion in demand. Entering May and June, net growth has declined for two consecutive months to 801 and 708—the trend of weakening momentum is more noteworthy than the single-month rebound.
III. 99.4% of Closures are Voluntary Cancellations: True Market Clearing Has Yet to Arrive
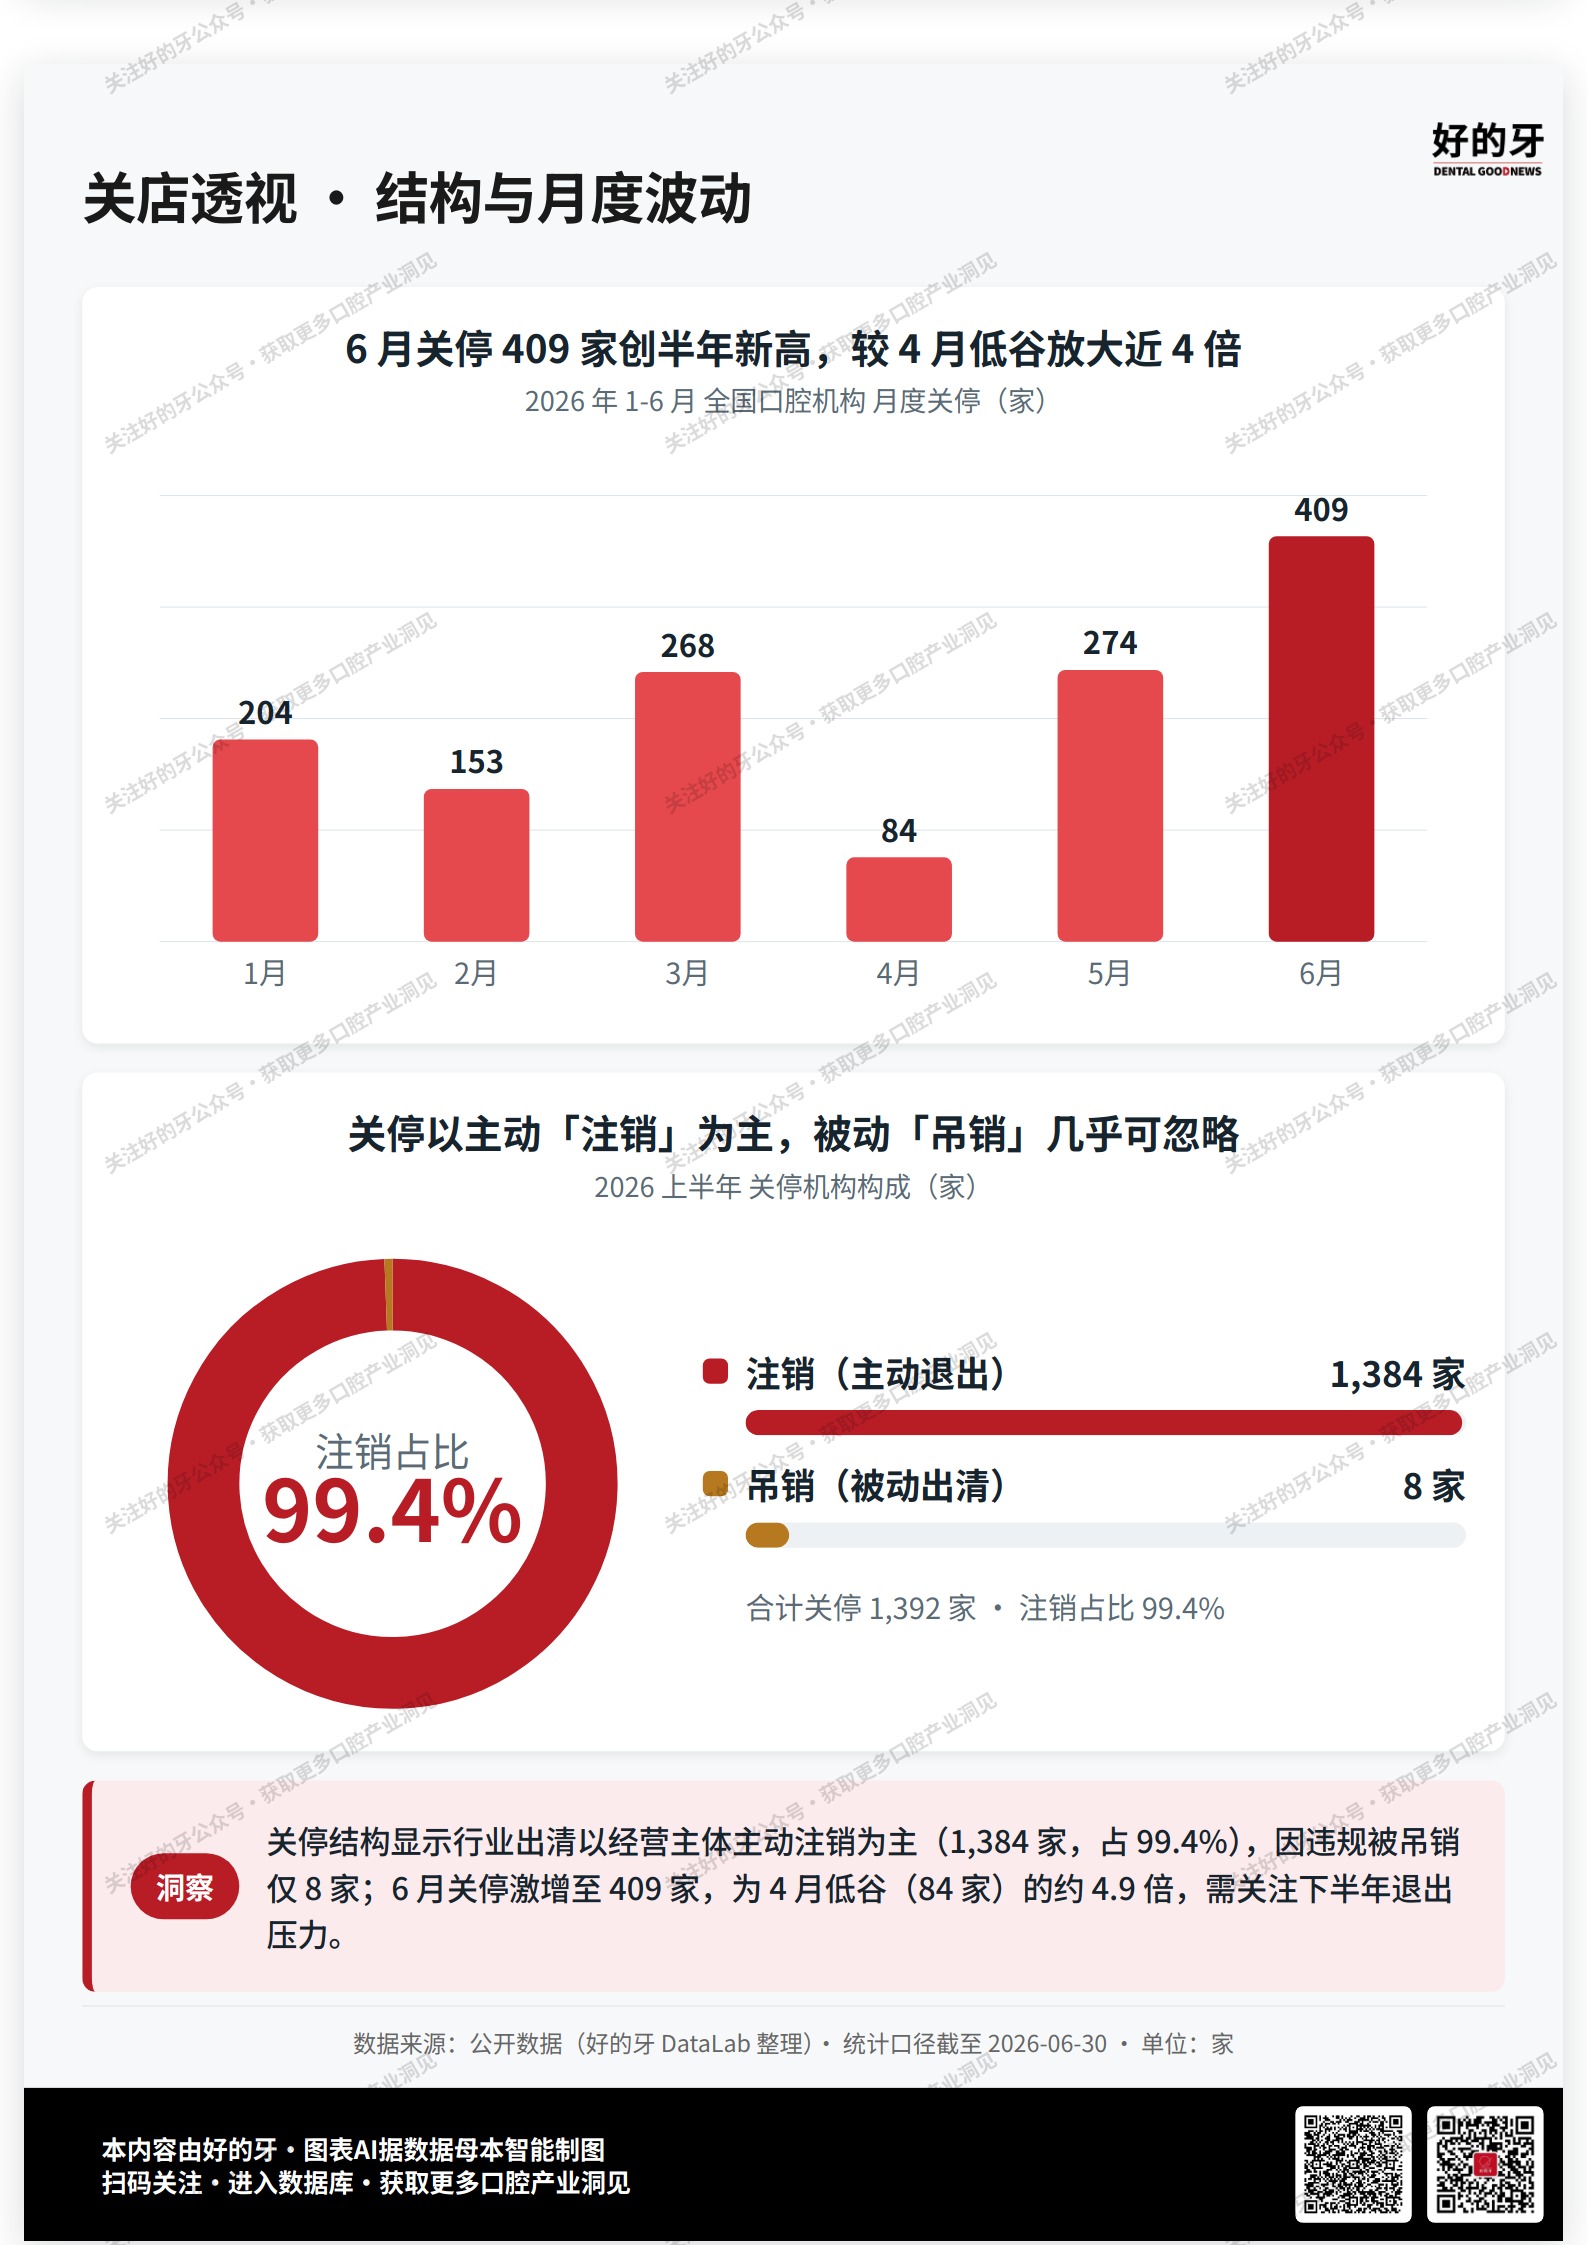
In the first half of the year, total closures reached 1,392, of which 1,384 were cancellations (99.4%), and only 8 were revocations. Cancellations represent voluntary exits by business entities, while revocations are forced exits after regulatory intervention. The over 99% cancellation rate indicates that current closures are more a result of individual business decisions after cost-benefit analysis, rather than systemic risk exposure at the industry level. However, closures in June reached 409, the half-year peak, a +49% month-over-month increase—closures are accelerating, still dominated by voluntary exits. If this trend continues in the second half of the year, with the closure curve rising further, the industry's clearing pressure will shift from "sporadic cases" to "structural manifestation."
IV. Hebei's "High Entry, Low Exit" vs. Shandong's "High Entry, High Exit": Two Survival Models
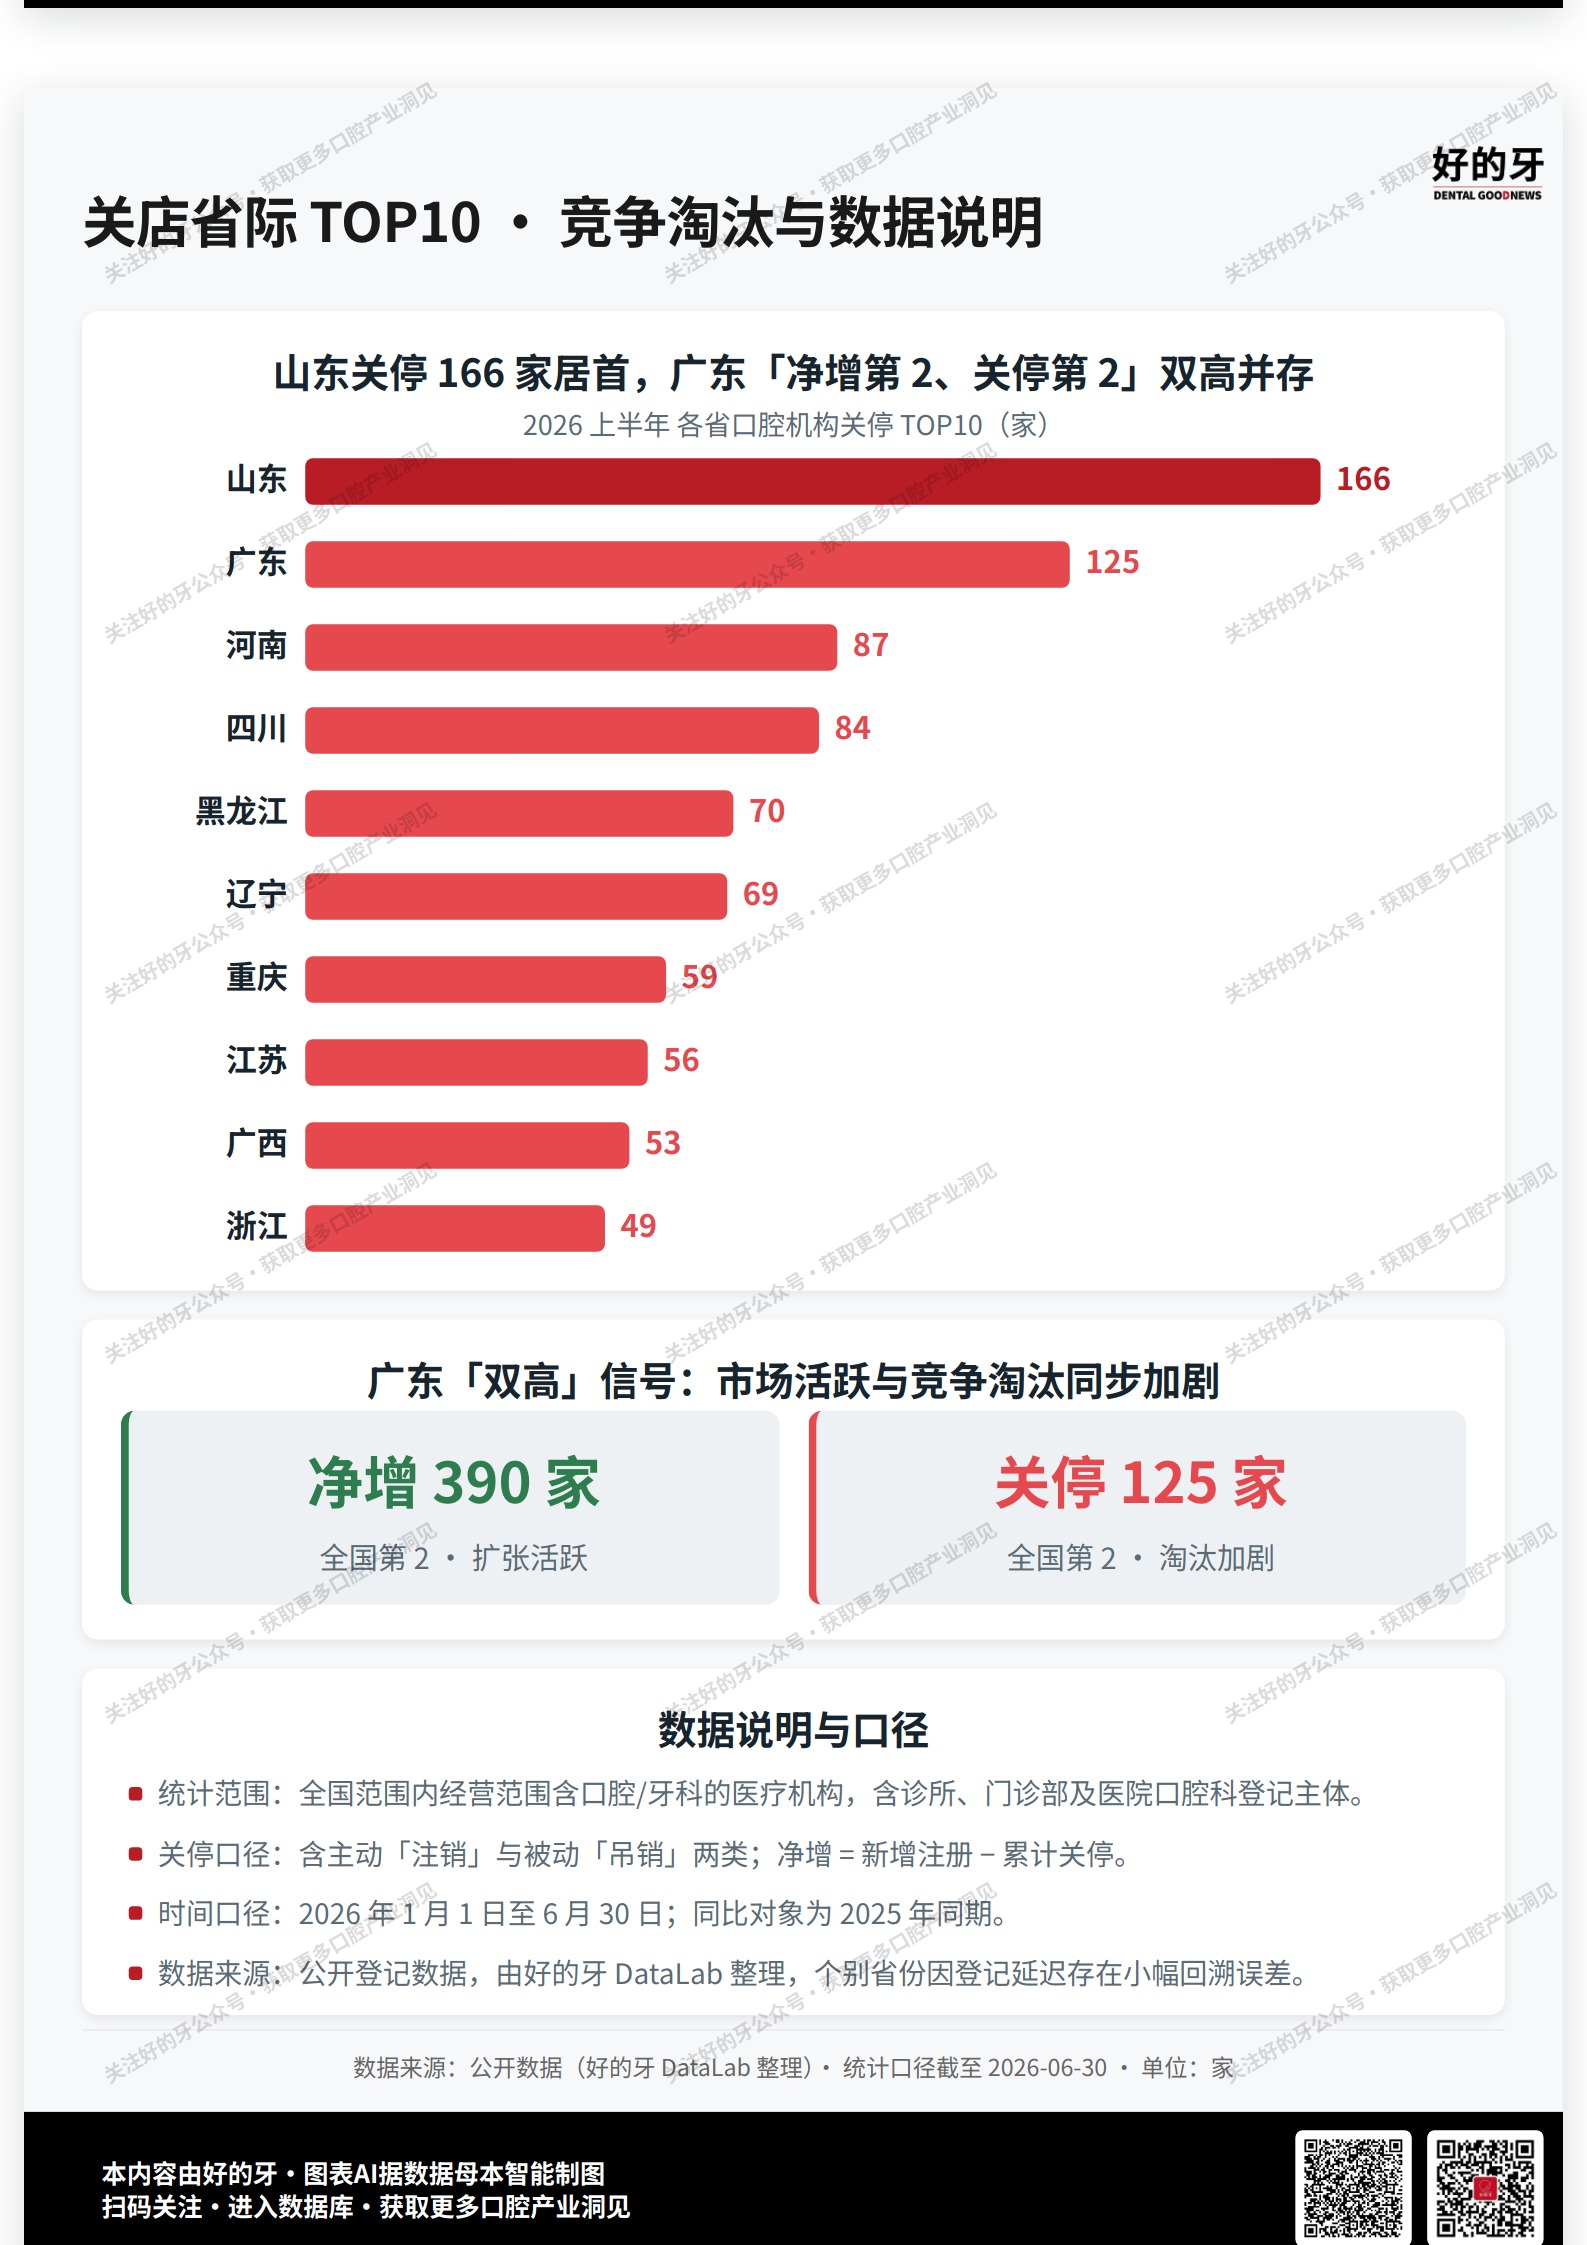
Inter-provincial data reveals two distinct survival paths. Hebei leads with a net increase of 412: 478 new registrations (second nationally) and only 66 closures—"high entry, low exit," indicating strong supply-side confidence and a market still in an absorption phase. Guangdong presents a different picture: 515 new registrations (first nationally) and 125 closures (second nationally)—"high entry, high exit," a market with high activity but also a high elimination rate.
More intriguing is Shandong: 459 new registrations (third nationally), 166 closures (first nationally), resulting in a net increase of only 293, placing it fourth. A high number of closures means many are entering, but many are also exiting—often a precursor to market saturation and intensifying competition. Whether a province can simultaneously accommodate high entry and high exit depends on the speed of market capacity expansion—Shandong's data suggests this speed may be falling behind the pace of elimination.
Incremental dividends are receding, and stock competition is unfolding on both sides of inter-provincial boundaries. The total net increase of 4,687 is not alarming in itself, but the distribution structure of growth has changed. When over 60% of new additions are concentrated in a few provinces, when the province with the most closures is also the one with the most new registrations, and when monthly net growth slides from a peak of 1,159 to 708 within half a year—the industry's "incremental dividends" are transitioning to "stock competition." In the second half of the year, whether the closure curve continues to rise and whether inter-provincial concentration further increases will be two core observation points for judging the pace of this transition.
1. Core Data Source: Public data, compiled by DGN DataLab (national and provincial dental medical institution business registration data).
2. Statistical Scope: January 1, 2026, to June 30, 2026, excluding Hong Kong, Macao, and Taiwan.
3. Note: Entities are defined as dental medical institution registration events (new registration, revocation, cancellation); total closures = revocations + cancellations; net growth = new registrations - total closures. The count unit is the number of registration events, not deduplicated by business entity.
| About DGN:DentalGoodNews (DGN) is a trusted professional media platform dedicated to the global dental industry. We deliver in-depth coverage of corporate news, policy & regulation, investment & funding, and clinical frontiers — serving dental institutions, device manufacturers, investors, and industry researchers worldwide. Contact us: haodeya@dongxizixun.com |

;)